The loop runs Analyze, Measure, Improve — in that order
The Loop Runs Analyze, Measure, Improve — in That Order
Curriculum Module 1 / Lesson 1.2. Lab shape: repair. Runtime: in-browser Python (Pyodide) and local starter workspace (courses/evals-engineering/).
Watch it fail
A billing support assistant takes refund tickets. Support tickets spike, so the team does what a good engineering team does: it writes tests. Over two weeks one engineer writes 200 synthetic cases covering every refund rule anybody can name. The suite reads 198 of 200 passing (99%). Nobody has looked at a single production trace.
Then the team does the next reasonable thing: it changes the system prompt to be warmer, and re-runs the suite. Still 198 of 200. Green before, green after, so the change ships.
Meanwhile, on the 40 traces the team actually served last week, 9 pass. Thirty-one fail, and they do not fail evenly:
| Failure mode | Traces | Share of the 31 failures |
|---|---|---|
unauthorized_refund_past_30d | 18 | 58.1% |
false_refund_denial_sla | 9 | 29.0% |
stale_policy_citation | 4 | 12.9% |
The 18-trace mode is the one from the previous lesson: a Standard-plan customer at day 45 gets a full $240 refund because a warm-tone line outranked the 30-day rule. The 200-case suite touches that mode 3 times, and all 3 cases are a polite customer at day 31. The 18 real failures are day 38–52 with a frustrated customer after the prompt edit.
Before you scroll: the suite was green, and 18 of 40 customers were getting money they were not owed. Which of the two numbers was wrong? Write one sentence. [ILLUSTRATION — simplified]
The mental model
Analyze, Measure, Improve is not three activities. It is one ordered loop, and the order is the whole lesson. You read traces first, so the thing you build measures a failure that actually happened. Reverse the order — build the checks first, then look — and you get a suite that is honest about failures nobody has.
Think of a locksmith. Analyze is examining the lock you were called about. Measure is cutting a key to that lock. Improve is turning it. A locksmith who cuts 200 keys before looking at the lock is not being thorough; he is guessing 200 times, and he will still not open your door.
The brakeless car from L1.1 is still the right picture: the gate is a brake. But a brake bolted to a wheel that is not on the car does nothing. Analyze decides which wheel you are braking.
The mechanism: the loop, step by step
| Step | Question it answers | Artifact it produces |
|---|---|---|
| 1. Analyze — open-code traces | What actually goes wrong, in the customer's words? | 40 traces each labelled binary PASS / FAIL with one written note |
| 2. Analyze — cluster | Which failures repeat, and how often? | A ranked list by trace count (the table above) |
| 3. Measure — write one binary gate | How do I detect this mode automatically, with the threshold fixed now? | refund_eligibility_binary, pass/fail, no score |
| 4. Measure — run it on the unpatched system | Does the gate see the failure I am about to fix? | It must be RED. A gate that is green before the fix is measuring nothing |
| 5. Improve — one change | What single edit targets this mode? | A prompt, retrieval, or code change aimed at the top mode only |
| 6. Measure again — same slice | Did the slice and the gate both move? | Pass rate before and after, and a gate that turns GREEN |
Two rules make the loop honest, and both are checkable:
- The gate must be red before the change. A brand-new check that passes on the broken system is not a gate; it is a description of the bug's absence. The fixture fixes this: on the unpatched build the gate passes 0 of 18 (
RED), and the same gate passes 18 of 18 (GREEN) on the patched build. Same check, two builds, opposite verdicts. - One change at a time, re-measured on the same slice. If you swap a prompt and a model and a chunk size, and the number moves, you have learned nothing about which one did it.
What "improve" actually bought
Fixing the top mode moves the slice from 9 of 40 (22.5%) to 27 of 40 (67.5%). That is a 45-percentage-point gain from one change, because the mode owned 18 of the 31 failures. But look at what is left: 13 traces still fail, split across the 9 SLA denials and the 4 stale citations. The loop does not end; it re-enters at step 1 with the next mode.
That is the Pareto shape of error analysis: two of three modes cover 87.1% of failures, all three cover 100%. You always fix the mode with the most traces first, because that is where the arithmetic is.
Why the 200-case suite stayed at 99%
This is the number that makes the lesson bite. Compare the two instruments on the same failure:
| Synthetic suite | Trace-derived gate | |
|---|---|---|
| Cases touching the top mode | 3 of 200 | 18 of 18 relevant traces |
| Coverage of the observed failures | 3 of 31 traces (9.7%) | the whole mode |
| Movement across the fix | 198 → 198 (0 cases) | 0 → 18 of 18 |
| Cost of getting it wrong | a green dashboard over 18 real failures | one red build before you ship |
Neither instrument is wrong in principle. The suite is wrong in order: it was written before anyone knew which failures were common. Coverage of the failures you observed is the only coverage that pays.
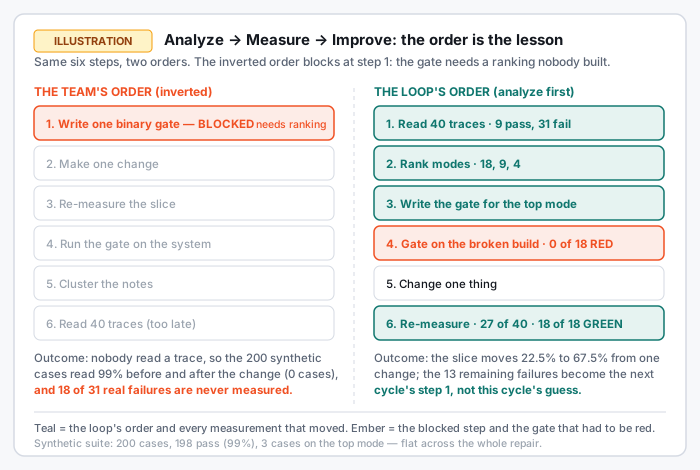
The picture: the two orders
Open the instrument and run the team's own order first.
The lab starts on the order the failing team actually used — write the check, make the change, measure, then (too late) run the gate, cluster, and read traces. Press nothing: it is already BLOCKED at its very first step, "Write one binary check for the top mode", because that step needs ranked_failure_modes and nothing earlier in that order produced it. The team wrote its 200 cases first, so it had no ranking to write a gate from; it called the result a gate anyway.
Now take the steps back and place them in the order the loop requires: read traces, cluster, write the gate, run the gate on the unpatched build, make one change, re-measure. The verdict flips to PIPELINE COMPLETE and prints the same numbers as the prose: 22.5% → 67.5%, gate RED → GREEN, synthetic movement 0.0%.
The blocking step is the whole lesson in one line. The inverted order does not fail because it is lazy. It fails because step 1 cannot start.
Try it: the first action
The lab also asks a smaller question — what does the pipeline need first? Pick an action and check it. The check does not compare your answer to a stored key; it asks whether the action produces what the next step in your own order requires. Four actions are offered:
- Write 200 synthetic cases → produces
synthetic_suite - Read 40 traces with binary notes → produces
labelled_traces - Swap in a larger model → produces
new_model_version - Rewrite the prompt from the loudest ticket → produces
prompt_edit
Only one of those four is an input to "cluster the notes". The other three are the three classic inversions: tests before traces, a bigger model instead of analysis, and one ticket as if it were a slice. Each is rejected with a number, not an opinion.
Because the check reads your own order, it also catches the order — not just the action. On the team's inverted order the first step that needs an input is "Write one binary check", which wants ranked_failure_modes; no offered action produces a ranking, so the lab says the order is at fault before it blames your pick. Put "Read 40 traces" first and the same four buttons judge the action itself.
Failure modes
- Synthetic-first ("Test Suite Theatre"). 200 imagined cases, 3 that touch the real top mode, 0 movement across the fix. Spot it by asking: which of last week's failures does this case come from? If the answer is "none, I thought of it", it is not covering anything you know about.
- Green gate ("The gate that cannot fail"). A brand-new check that passes on the broken system. Spot it by running the new check on the current build before you change anything. Steps 3 and 4 are one step in disguise.
- Multi-change improve ("The un-attributable win"). Prompt plus model plus chunks at once. Spot it by the diff: if Improve touched two mechanisms, the measurement is void.
- Ticket-driven fix ("The loudest sample"). The angriest ticket is one trace. In the fixture it could easily be one of the 4 stale citations — the smallest mode — and fixing it moves the slice from 9 to 10 passing.
- Metric without a slice change. You can also run the whole loop correctly and still cheat at the last step by reporting a different metric than the one the gate measures. Re-measure the same 40 traces; not a fresh sample, not the synthetic suite.
One-line close
Analyze first, and the gate you build measures a failure that happened; build first, and it measures a failure you imagined.
What breaks next: even a correctly ordered loop still needs every one of its five parts named — task, dataset, grader, metric, decision rule — or the "gate" quietly turns into a dashboard number. That contract is Lesson 1.3.
Home numbers / honesty table
| Item | Value | Label |
|---|---|---|
| Production slice | 40 traces, 9 pass, 31 fail | ILLUSTRATION fixture |
| Baseline pass rate | 9 / 40 = 0.225 (22.5%) | REAL: computed by the lab, test_exercise.py, prove-home-numbers.py |
| Failure counts | 18, 9, 4 | ILLUSTRATION fixture |
| Top mode share of failures | 18 / 31 = 58.1% | REAL: computed in lab, exercise and prove script |
| Two-mode Pareto | 87.1% of failures | REAL: computed in exercise and prove script |
| Pass rate after fixing the top mode only | 27 / 40 = 0.675 (67.5%) | REAL: computed in lab, exercise and prove script |
| Failures remaining after that fix | 13 | REAL: computed |
| Synthetic suite | 200 cases, 198 pass (99%), 3 cases on the top mode | ILLUSTRATION fixture |
| Synthetic coverage of the top mode | 3 / 18 = 0.1667 (1 in 6 traces) | REAL: computed |
| Synthetic movement across the repair | 0 cases (99% → 99%) | REAL: computed |
| Binary gate, unpatched build | 0 / 18 pass, RED | REAL: computed by the lab and the pytest suite |
| Binary gate, patched build | 18 / 18 pass, GREEN | REAL: computed by the lab and the pytest suite |
| Cassette replay cost | $0.00 (sockets blocked in conftest.py) | REAL: verified by test_offline_socket_guard_blocks_live_network |
| Lesson video | not shipped | No render in this build |
Lab spec (courses/evals-engineering/modules/m01_eval_mindset/l01_2_analyze_measure_improve/)
cd courses/evals-engineering
pytest modules/m01_eval_mindset/l01_2_analyze_measure_improve/ -k "not student" -v
Two student functions in exercise.py start as None: order_pipeline() returns the six step ids in a runnable order, and rank_failure_modes() returns the failure modes sorted by trace count. The suite fails on the stubs with a specific message, fails on the team's inverted order (blocked at its first step, writing the gate), and passes on the reference order.
Video
No rendered lesson video is shipped in this build. No clip script is committed for L1.2 either; the lesson's teaching is carried by the pipeline still and the lab.