Introduction to Machine Learning
Introduction to Machine Learning
Machine learning is the discipline of building systems that improve from data. Instead of writing every rule by hand, we define a goal, collect examples, choose a model family, train the model, and measure whether the learned behavior works on cases it has not seen before.
That last clause is the soul of the subject: machine learning is not about memorizing yesterday's spreadsheet. It is about generalization. A spam detector that only recognizes the exact spam emails in the training set is not learning in the useful sense. A house-price model that only works for houses already sold is not a prediction system. Good machine learning compresses patterns from past data into a model that remains useful on future data.
Watch that claim in motion: a cubic that follows the curve on new , then a wiggly fit that hugs the training dots.
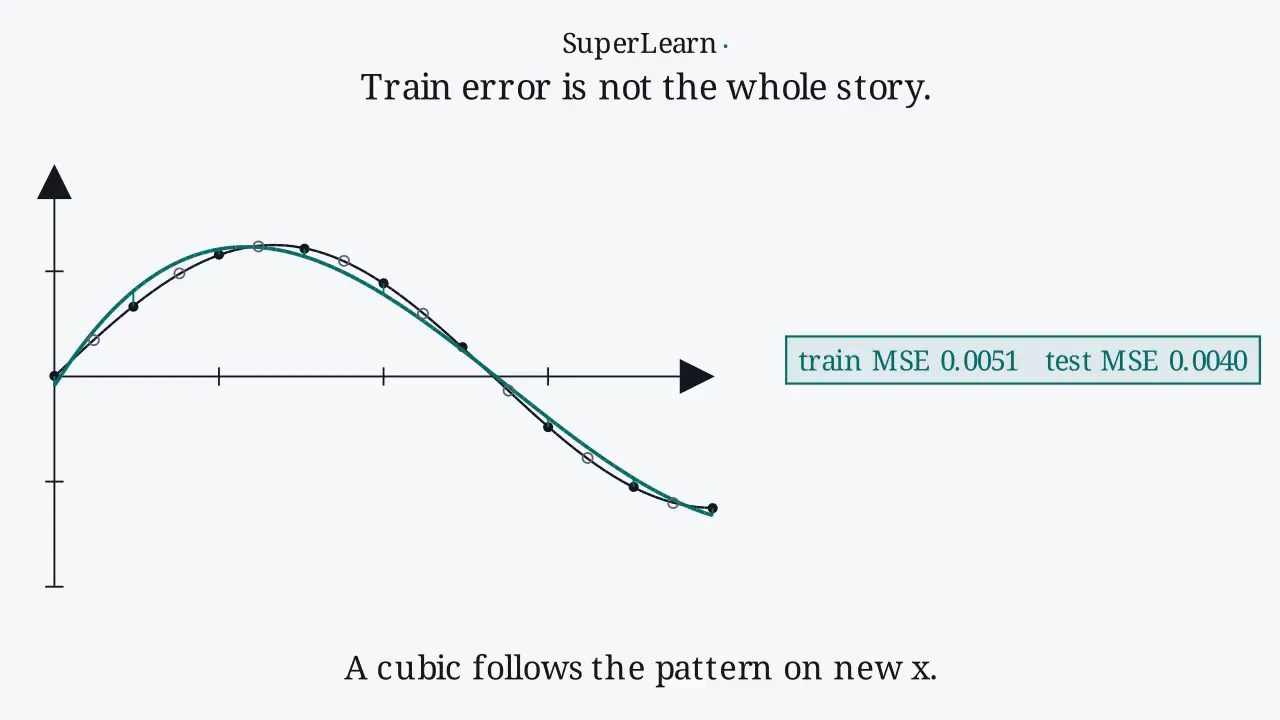
The sections below fill in the loop around that picture — rules, features, loss, and how we check a fit on data the model was not allowed to see.
Why explicit rules break down
Imagine building a spam filter by writing rules:
- If the subject contains "free money", mark spam.
- If the sender has many numbers, mark spam.
- If the email contains five exclamation marks, mark spam.
This works for a week. Then spammers change their wording. Legitimate newsletters use excited punctuation. A bank sends a real fraud warning from an unfamiliar address. The rule list grows, contradicts itself, and becomes impossible to maintain.
Machine learning changes the workflow. Instead of asking "What rule should I write?", we ask:
- What examples show the behavior I want?
- What inputs are available at prediction time?
- What output should the model learn?
- What metric tells me whether the model is useful?
- What failure modes would be costly or unfair?
This is why ML became central in search, recommendations, speech recognition, fraud detection, medical triage, translation, forecasting, and modern generative AI. The problems are too varied, noisy, and adaptive for static rules alone.
The machine learning lifecycle
The most common beginner mistake is to think "model training" is the whole project. In real systems, the model is only one stage in a larger loop.
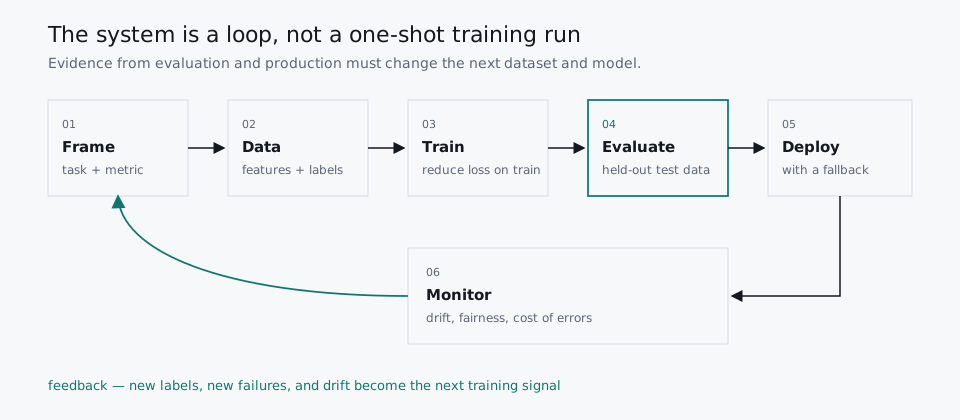
The teal box is the honesty step. Training can always drive loss down on the examples it is allowed to see. Evaluation on held-out data, and later monitoring in production, are how we find out whether the pattern still works. The return arrow is not decoration: new failures become the next dataset.
The lifecycle is intentionally circular:
- Frame the problem. Translate a real goal into an ML task. "Reduce support backlog" might become "classify incoming tickets by urgency."
- Collect and understand data. Identify features, labels, missing values, bias, leakage, and the source of truth.
- Train a model. Pick a model family and optimize its parameters to reduce loss on training data.
- Evaluate generalization. Test on held-out data, not on the examples used for training.
- Deploy carefully. Put the model behind a product workflow with logging, fallback behavior, and monitoring.
- Monitor and improve. Data changes over time. A model can decay even if the code never changes.
The diagram belongs at the beginning because it prevents a distorted mental model. Machine learning is not "throw data at an algorithm." It is an evidence loop.
The core definition
A useful practical definition is:
A machine learning system learns from examples when its performance on a task improves with experience, measured by an explicit metric.
That definition contains four parts:
- Task: what the system must do, such as predict a price, rank search results, segment customers, or choose an action.
- Experience: the data or interaction history used for learning.
- Model: the mathematical object that stores the learned pattern.
- Performance measure: the metric that decides whether the model is improving.
For supervised learning, the data often looks like pairs:
Here, each input is a feature representation and each label is the target answer. The model learns a function:
The model is successful when gives useful predictions for new examples, not only for the training rows.
A first mental model: input, pattern, prediction
Every ML system can be read as a flow:
- Raw situation: an email, image, transaction, student answer, patient scan, sensor stream, or user session.
- Features: a machine-readable representation of the situation.
- Pattern recognition: the model detects statistical structure in the examples.
- Prediction or action: the model outputs a label, number, ranking, generated object, or decision.
- Feedback: humans, metrics, or the environment reveal whether the output was useful.
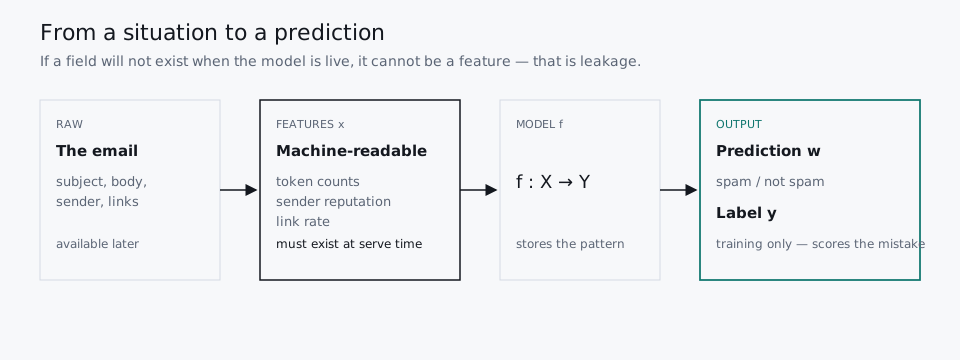
Read the figure left to right. The raw email still exists in the world. Features are the slice of that world the model is allowed to see when it is live. The label is the answer used to score a mistake during training. If you train on a field that will not exist at serve time — a "this email was later marked spam" flag, a post-default collection note — the metric lies. That failure is called leakage.
A concrete supervised row for house prices looks like this:
| Role | Example | Available later? |
|---|---|---|
| Features | 2,100 sqft, 12 years old, neighborhood score 8 | Yes — you can measure these for a house not yet sold |
| Label | $482k sale price | Only after the sale. This is what the model is trying to guess |
| Prediction | the model's current guess | Yes — this is the output you ship |
This is not magic. The model is using regularities in past observations. If the examples are biased, stale, mislabeled, leaked, or too narrow, the learned pattern will inherit those weaknesses.
The main types of machine learning
Different learning setups answer different questions. The type is a statement about the experience you can give the system, not a list of algorithm names.
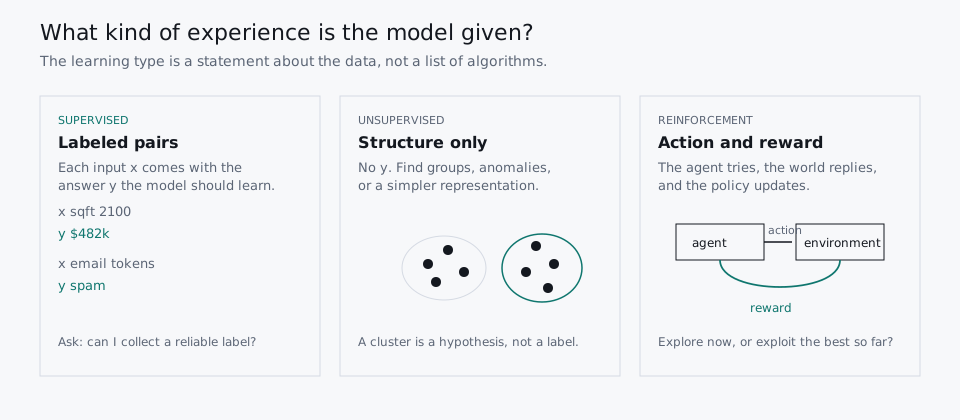
If you can point to a reliable for each example, you are in the supervised panel. If you only have and want structure, you are in the middle. If the system must act, change the world, and collect a score over time, you are in the reinforcement loop. Semi-supervised sits between the first two: a few labels, many unlabeled examples.
Supervised learning
Supervised learning uses labeled examples. Each training input comes with the answer the model should learn to predict.
Use it when:
- You know the target variable.
- You can collect reliable labels.
- You want predictions for future cases.
Typical tasks:
- Classification: predict a category, such as spam/not spam or disease/no disease.
- Regression: predict a number, such as price, demand, risk, or temperature.
Example:
from sklearn.linear_model import LogisticRegression

model = LogisticRegression()
model.fit(email_features, spam_labels)
prediction = model.predict(new_email_features)
The supervision is the label. The algorithm can compare its prediction with the correct answer and adjust.
Unsupervised learning
Unsupervised learning receives inputs without explicit labels. The goal is to find structure.
Use it when:
- You do not have labels.
- You want to discover groups, trends, anomalies, or lower-dimensional representations.
- You are exploring data before defining a prediction task.
Typical tasks:
- Clustering customers by behavior.
- Detecting unusual transactions.
- Compressing high-dimensional features with PCA.
- Finding topics in text.
Unsupervised learning is powerful, but its outputs need interpretation. A cluster is not automatically meaningful just because an algorithm produced it.
Semi-supervised and self-supervised learning
Semi-supervised learning combines a small labeled dataset with a larger unlabeled dataset. Self-supervised learning creates training signals from the data itself, such as predicting masked words or matching augmented views of the same image.
These methods matter because labels are often expensive. A hospital may have millions of scans, but only a small subset carefully labeled by specialists.
Reinforcement learning
Reinforcement learning trains an agent through interaction. The agent observes a state, chooses an action, receives reward or penalty, and updates its policy.
Use it when:
- The system makes sequences of decisions.
- An action changes what happens next.
- Success is measured by cumulative reward.
Examples include game agents, robot control, resource allocation, and some recommendation or ranking systems. Reinforcement learning introduces the exploration-exploitation dilemma: should the agent try something uncertain to learn more, or choose the best-known action now?
Interact with the whole learning loop
The workbench below is a checkpoint, not a dashboard. First predict the learning setup from a short clue. Then treat house size, age, and neighborhood as features, the sale price as the label, and mean absolute error as the gap . Shuffle the table if you want a new sample. Points on the diagonal match the label; teal points are within $25k.
Use it until two things feel obvious: (1) you can name and before you name an algorithm, and (2) moving a weight changes loss because it changes the mapping from features to the label.
Loss: the model's correction signal
Training needs a way to score mistakes. A loss function converts prediction error into a number the optimizer can reduce.
For regression, a common loss is mean squared error:
For classification, cross-entropy is common because it rewards confident correct probabilities and heavily penalizes confident wrong probabilities.
Loss is not always the final business metric. A medical model might optimize cross-entropy during training but be evaluated with recall, precision, calibration, and clinician review. A fraud model might optimize ranking quality while the business cares about dollars saved and false investigation cost.
The train-test split
If we evaluate a model on the same examples it trained on, we mostly measure memory. To estimate generalization, we split data:
- Training set: used to fit parameters.
- Validation set: used to tune choices such as features and hyperparameters.
- Test set: used as a final estimate of performance on unseen data.
This split is simple but profound. It forces honesty. A model that looks excellent on training data and poor on validation data is probably overfitting.
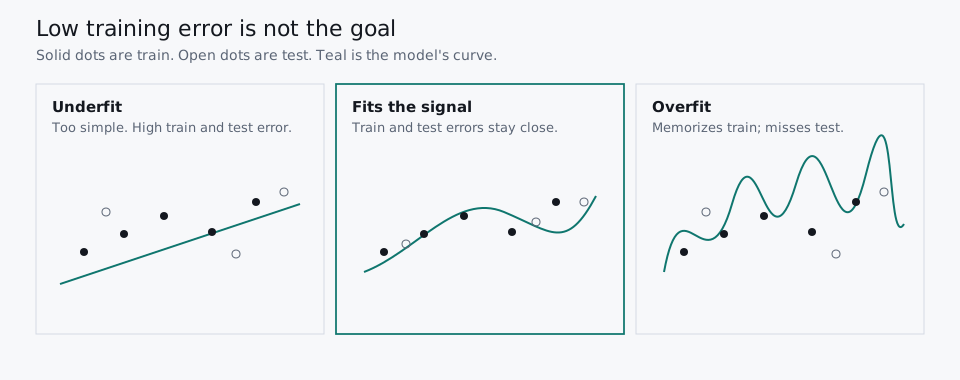
Solid dots are the training set. Open dots are the test set. The left panel is too simple: both errors stay high. The middle panel follows the bend without chasing every wobble. The right panel threads the training points and misses the held-out ones. That is the picture to keep when someone reports "99% accuracy" without saying which split.
Here is the same idea with the lesson home numbers: a cubic fit on the training slice, scored on the held-out points.
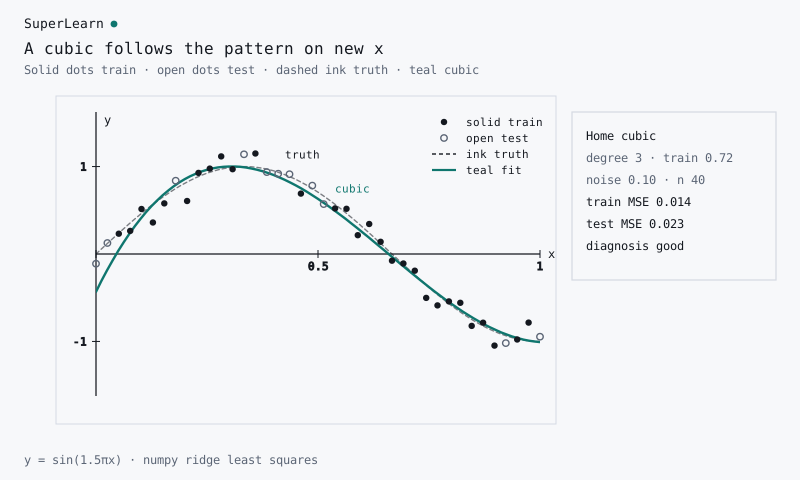
That computed still is the explorer’s home setting. The lab below is where you force the left and right panels on purpose.
Watch generalization fail on purpose
Here is the named fail with the same lock the lab uses: degree 8, train fraction 0.35, noise 0.22.
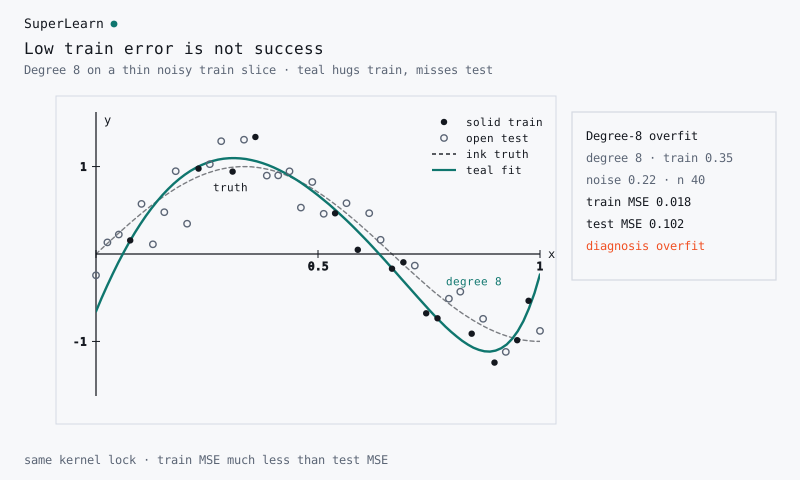
Train error is low; test error is not. That is overfit on this split.
The explorer below fits a polynomial to a noisy curve. Three controls, each tied to a misconception: extra degree is not automatically better; a tiny training slice makes memorization easy; noise is not a reason to demand a perfect fit. Force the failure mode: degree 8, train fraction near 0.35, visible noise. Train MSE falls while test MSE rises.
When the diagnosis reads overfit, you are looking at the reason production models are not scored on the spreadsheet they were fit to. When it reads underfit, the model family never had a chance to represent the signal. The home setting is a moderate cubic on most of the data — the still that should make sense before you touch a slider.
The most important failure modes
Garbage in, garbage out
If labels are wrong or features are unreliable, the model can learn the wrong pattern very efficiently. Better algorithms rarely fix broken measurement.
Leakage
Leakage happens when training data contains information that would not be available at prediction time. For example, predicting loan default using a field that is only filled after default occurs creates fake performance.
Overfitting
An overfit model learns details of the training set that do not generalize. It performs well on known data but poorly on new data.
Underfitting
An underfit model is too simple or poorly specified to capture the real relationship. It performs poorly even on training data.
Distribution shift
The world changes. User behavior, fraud patterns, markets, medical protocols, sensors, and content formats drift. Monitoring is part of the ML system, not an afterthought.
Ethical and social harm
ML systems can amplify unfairness when historical data reflects biased decisions. A model can be statistically accurate overall while failing badly for a subgroup. Responsible ML requires subgroup evaluation, explainability where appropriate, privacy protection, and human oversight for high-stakes decisions.
A practical checklist for any ML problem
Before choosing an algorithm, answer:
- What decision will this prediction influence?
- What is the exact target variable?
- What data is available at prediction time?
- How will training, validation, and test data be separated?
- Which metric matches the cost of mistakes?
- What simple baseline must the model beat?
- How will errors be inspected by subgroup and scenario?
- What monitoring will detect drift after deployment?
What comes next
This lesson gives the map. The next lesson zooms into the first major supervised learning algorithm: linear regression. Linear regression is simple enough to understand completely, yet deep enough to introduce the central ideas of prediction, loss, optimization, coefficients, residuals, diagnostics, and model trust.
Sources consulted
- Google Machine Learning Crash Course for terminology, loss, generalization, and production framing.
- scikit-learn user guide for model-family conventions and practical API patterns.
- Stanford CS229 notes for supervised-learning notation and optimization framing.
- An Introduction to Statistical Learning for statistical-learning structure and generalization intuition.
- Russell and Norvig's Artificial Intelligence: A Modern Approach for the broader AI framing.